Static Infographic
Static Infographics: Effective Visualization for Clear Communication
As communication professionals, we understand the value of data visualization in presenting complex information clearly and effectively. A static infographic is a versatile way to share complex data with a wide audience. In this blog post, we’ll explore the basics of static infographic design and provide tips for creating an effective visual representation of your data.
A static infographic is a type of infographic that remain unchanged over time. They are often used to display data or statistics in a visually appealing way and can be used on websites, social media, and in print materials.
A static infographic can be created relatively quickly reducing costs. So for low cost, written text can be transformed into visually appealing infographics.
Static Infographics: Simplifying Complex Learning Materials
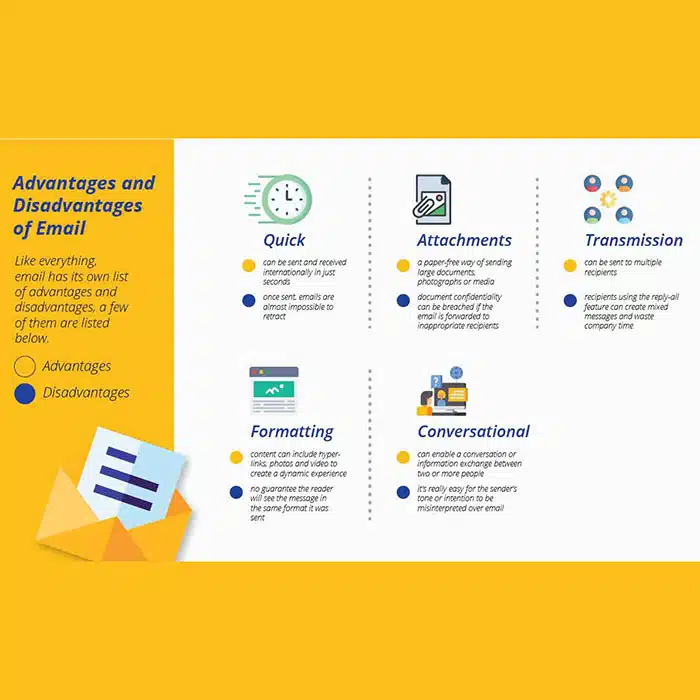
A static infographic is an important elearning feature. Complex tables, charts, or diagrams that contain too much information can be displayed in a visual format because complex information can be summarize into a visual display that is simple and can be quickly understood by the user.
A static infographic is important for the user because the information contained in the elearning module can be understood quickly. A user does not want to scroll through copious amounts of data to find information. Instead, if a visual diagram has the required information well organised and easy to read, then the user will find the information quickly
A static infographic is an important elearning feature because:
- They are a great way to share data and information with your audience
- They are easy to understand and can be used to explain complex concepts
- They can be used on websites, social media, and in presentations
- They can include accurate and up-to-date information
A static infographic is a powerful way to share complex data with your audience. When done well, they can be an effective means of communication and help people understand difficult concepts quickly and easily. In this blog post, we’ve outlined the basics of static infographic design and shared some tips for creating an effective visual representation of your data. If you’d like more information or would like us to help you create an infographic, contact us today. We’d be happy to work with you!
Explore More: Advanced Insights on Static Infographics
Lemonly Infographics: This page showcases a variety of static infographics, categorized into types such as classic infographics, microcontent, and reports. It’s a great resource for seeing different ways static infographics can be used to present information visually. You can explore their work and get inspired by different designs and applications of static infographics at Lemonly.
Static and interactive infographics in daily tasks: A value-in-use and quality of interaction user study: This research compares static and interactive infographics in terms of user perception and use in daily tasks. Link
Creating Effective Infographics and Visual Abstracts to Disseminate Research: This page discusses the creation of effective infographics and visual abstracts for disseminating research findings. Link
Related elearning experiences: An Infographic Is Important, Screencast eLearning Strategies, Animated Infographic, Screencast Practical Demonstration.