Infographics
What is an Infographic?
An infographic is a visual representation of written text which is used to explain a concept. Bright colours will elegant fonts, big bold diagrams and interactive features will grab the user’s attention and promote learning. Aesthetically pleasing and interactive infographics can make mundane written text more exciting and appealing to learn. Infographics can turn difficult to learn written concepts into a visual presentation that is easier to understand.
A static infographic is a stationary image normally a flow chart, diagram, or picture. An animated infographic normally has moving objects presented in a visually appealing manner. Interactive off-the-shelf infographics are standard elearning authoring tools and are normally a click to reveal, drag and drop, or a hot spot. The learner can interact with the content, and they become involved in their own learning process. Infographics are a visual learning aid to help learners understand basic concepts.
How can I use an infographic?
Infographics can be used to make complex information more understandable and to make data more engaging. Infographics are often used by businesses and organizations to communicate data-driven stories. They can be used to promote a product or service, to increase understanding of a brand, or simply to share knowledge. Infographics can be shared online, in print, or in presentations. When used effectively, infographics can be an incredibly powerful tool for communication.
Survey data
Data is best displayed with visually appealing elements that catch the user attentions making the data more impactful
Simplify complex concept
Lengthy and complex concepts explained with written text can be broken down into easy to understand pictures
Topic summary
Present a summary of an extended explanation in a visualling appealing summary of the main points
Topic overview
A course overview can be presented in a way that makes it easy to understand through pictures
Processes and procedures
Use a diagram or flow chart to represent the main steps for you business process or procedures
Graphs and tables
Information presented in graphs and tables are easier to understand and to process improving learning
Infographic benefits
Simple
The use of infographics in the educational and training environment has been proven to improve learning because break up large amounts of text and they are easily understood by learners
Visuals
Vibrant visuals are a great way to keep your audience's attention. Make use of bright colors, animations and other eye-catching elements like fonts that will engage them in what you're presenting!
Highlight key points
Emphasize key points to make it easier for the user. Highlight important information and topics so users know what they are reading or watching, which will ultimately help them learn
Story telling
Use infographics to tell the story thoughout an elearning course. Multiple graphics and visual representations aid learners in following along with what's being taught
Visual learners
The majority of people are visual learners which means they need to see information to learn it. Infographics increase your users chance of success by presenting information visually
Holding attention
It is a lot more interesting and engaging to see something than just read about it. It's easier for people to process visuals instead of text therefore holding their attention
Infographic development process
The Infographic Development Process is our consultancy procedure we go through with you to ensure your infographics portray the message and associated information needed for your elearning courses. We need to understand your content, then we provide options basedon your need for a static image/infographic, animated infographic, or interactive infographic. We then provide a first look at the animation, so you can see some of the interactions that will happen in the final product. Then we get your feedback, and implement any changes needed. Finally, we deliver the final product for you to use in your elearning courses. The Infographic Development Process ensures that your infographics are high quality and fit your needs perfectly.
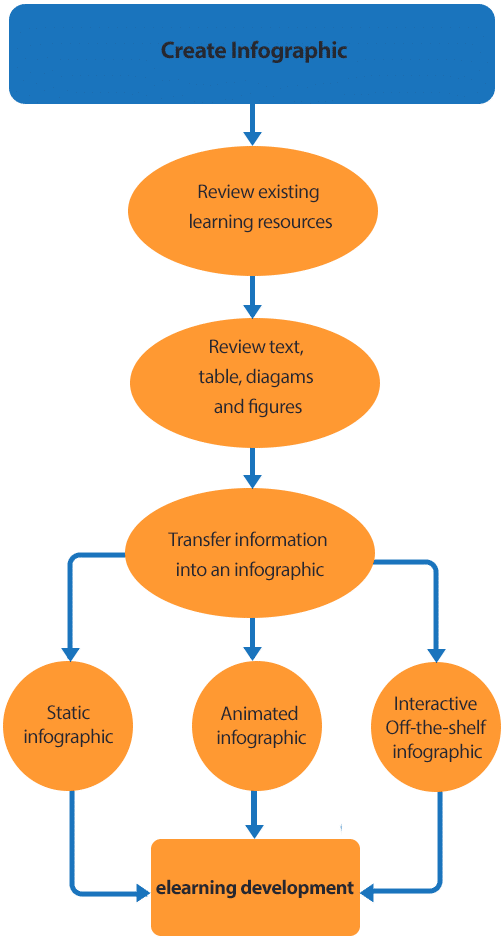
Infographic development process explained
Review existing learning resources?
Infographic planning must begin with existing learning resources. An infographic is simply a visual representation of the written text. Organised content found in existing learning resources will ensure creating an infographic is more efficient and productive. The content is normally a workbook, or a PowerPoint slide. Organised content contains heading and subheadings which represent concepts to be learn. It is these concepts that will be transformed into infographics.
Review text, tables, diagrams, and figures
Ultimately any information can be transformed into an infographic, but the text still needs to be chosen carefully. Existing learning resources should have range of concepts that build an understanding of the main concept. If the text is organised with heading and subheadings, it will be easy to transform concepts into an infographic. Tables, diagrams and figures already have this concept hierarchy structure in place which is why they are ideal to transform into an infographic.
Transfer information to an infographic
Once the information to transfer to the infographic has been selected, the infographic creation process begins. The type of infographic will need to be chosen.
Static infographic – is a stationary picture that presents a concept to learn in the form of a graphic, chart, table, diagram or other visual element.
Animated infographic – animates the main concepts via moving images, illustrations, or any form of graphic.
Add infographic to elearning development
elearning space will build your infographic in the context of your overall elearning development strategy.
Infographic price inclusions
Review exiting learning resources
Identify main concepts found in existing resources
Determine information to be transferred to an infographic
Calculate number of infographics to be produced
Client involment and contribution to the infographic
Determine infographic complexity
Create storyboard
Determine type of infographic
Determine additional visual features
Align with elearning strategy
Contact us for a quote
Or ask us anthing. We are happy to help!